• Next.js performance optimization becomes increasingly important in large-scale projects where application complexity and traffic grow significantly.
• Large Next.js applications often face performance challenges related to bundle size, inefficient data fetching, and unnecessary client-side rendering.
• Careful architecture decisions, including modular code structure and optimized rendering strategies, help maintain performance as projects scale.
• Monitoring performance metrics and analyzing real-world usage data helps teams identify bottlenecks in complex applications.
• Development teams should continuously review dependencies, optimize assets, and improve caching strategies to prevent performance degradation.
• Lessons learned from large production projects can help developers build faster, more maintainable Next.js applications at scale.
Introduction to Next js Performance Optimization
At Pagepro, we’ve spent years developing and optimizing high-traffic Next.js websites and apps for our clients. Along the way, we’ve faced numerous challenges and learned crucial lessons about Next js performance optimization. Recently, we conducted an in-depth survey across our development, QA, and project management teams to distill our collective knowledge into actionable insights.
As a result today we’re sharing our top five lessons for for Next.js performance optimization in large projects. These hard-earned insights will help you avoid common pitfalls and improve scalability, reduce costs associated with slow load times, and enhance user satisfaction—driving both technical and business success.
If you prefer video content, check out the video I recorded with our CTO, Jakub Dakowicz:
Lesson 1: Use the Power of Chrome’s Performance Tab
The Performance Tab in Chrome DevTools is often overlooked, but it’s a goldmine of information for performance optimization. Our lead developer, Jakub, admits that he initially found it overwhelming, but with practice, it became an indispensable tool in our optimization toolkit.
At first, I tried to convince myself that there was nothing useful in the Performance Tab, but I was simply intimidated by the data I didn’t understand at the time. Now, I see how much valuable information it provides about your app, and I use it every day. I highly recommend it to everyone.
Jakub Dakowicz, CTO at Pagepro
Key Benefits of the Performance Tab:
Precise Performance Peaks Identification: Pinpoint exact functions causing performance spikes.
Comprehensive Execution Analysis: View all network requests and code executions on the main thread.
Detailed Asset Loading Insights: Track when and how assets are loaded.
Core Web Vitals Monitoring: Keep an eye on crucial metrics like First Contentful Paint (FCP) and Largest Contentful Paint (LCP).
Pro Tip: Name your functions instead of using anonymous ones. This practice not only follows good coding standards but also makes it easier to identify problematic functions in the Performance Tab.
Get Next.js Vercel Cost Optimization Guide
Learn real-life techniques to optimize the hosting costs of your Next.js apps.
Thank you for signing up. Check your e-mail for the guide.
Real-world Impact
We once had a carousel component that was taking a whopping two seconds of main thread work – a significant performance bottleneck. Using the Performance Tab, we identified the issue and replaced the library with a more CSS-focused one (React Snapscroll). The result? We slashed the execution time to just 200 milliseconds – a 10x improvement! It influences the user experience but also improves site responsiveness, helping the client maintain engagement and avoid potential revenue loss from slow performance.
But it doesn’t stop there. The Performance Tab also helped us uncover and fix an Interaction to Next Paint (INP) issue with our image lightbox component. We found that lazy-loading the component was causing a noticeable freeze when users clicked on images. By adding a simple loading indicator, we significantly improved the perceived performance and user experience.
One of the most significant mindset shifts we’ve made at Pagepro is moving away from treating performance optimization as a final step in the development process. Previously, addressing performance at the end of development often led to costly rework, bottlenecks, and technical debt. Now, by embedding performance checks throughout the entire development cycle, we’ve minimized the risk of late-stage surprises and created a more efficient, data-driven approach to optimization.
Why Continuous Monitoring Matters:
Early Problem Detection: Catch performance issues before they compound and become harder to fix.
Consistent Performance: Ensure new features don’t negatively impact overall site performance.
Data-Driven Development: Make informed decisions based on ongoing performance metrics.
How We Implement Continuous Performance Monitoring at Pagepro:
1. Pre and Post-Merge Checks:
Before merging: Developers run performance checks on their local environment.
After merging: Automated checks run in the staging environment.
2. Automated CI/CD Pipeline:
We use Lighthouse CI integrated into our GitHub Actions workflow.
Every pull request triggers performance tests, flagging any regressions.
3. Comprehensive Metrics Focus:
Core Web Vitals (LCP, FID, CLS, INP)
Time to Interactive (TTI)
Total Blocking Time (TBT)
Core Web Vitals visible in Performance Tab of Chrome DevTools
4. Advanced Tooling:
React DevTools Profiler for component-level performance analysis
Vercel Analytics for tracking Core Web Vitals across all our projects
5. Regular Review Process:
Weekly team performance reviews to discuss trends and address consistent issues
Monthly performance reports for clients on SLA projects
6. Custom Performance Dashboard:
We’ve developed an internal dashboard that aggregates performance data across all our projects.
This allows us to spot trends, compare projects, and identify best practices.
Actionable Advice:
Start small: Begin with basic Lighthouse checks in your CI/CD pipeline.
Gradually increase complexity: Add more detailed checks and custom metrics as your team becomes more comfortable with the process.
Make performance data accessible: Create dashboards or reports that all team members can easily understand and act upon.
Set performance budgets: Establish thresholds for key metrics and automatically flag when they’re exceeded.
Lesson 3: Reduce code on the client to a minimum
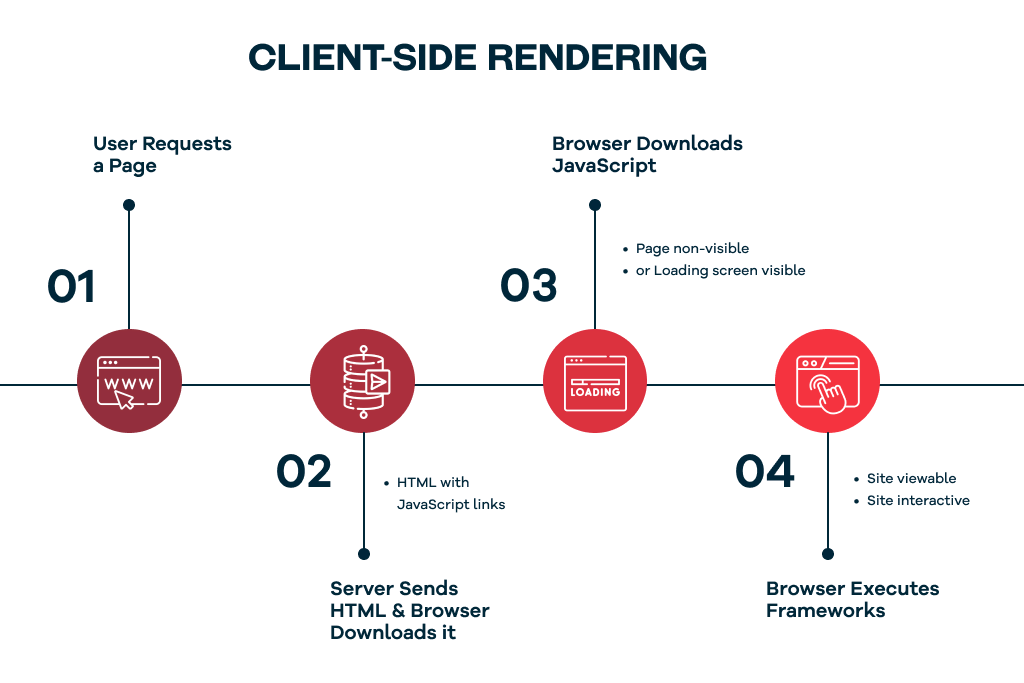
Understanding the fundamentals of Next.js and how it handles server-side and client-side code is crucial for optimization. Once you grasp this, the next step is to focus on reducing the amount of code running on the client.
Keeping client-side code to a minimum is essential because it directly impacts load times, reduces the bundle size, and ensures faster, more responsive user experiences. Too much code on the client can overwhelm the browser, leading to performance bottlenecks and degraded user interactions.
Client-Side Rendering
Key Considerations:
Code Distribution: Be aware of what’s served to the client, what runs on the server, and what’s generated during the build process.
Import Management: Carefully manage imports to avoid accidentally including server packages on the client-side bundle.
Bundle Analysis: Regularly use tools like Bundle Analyzer to visualize your bundle composition and identify opportunities for optimization.
Strategies for Optimizing Client-Side Code:
Lazy Loading: Implement lazy loading for below-the-fold components or those triggered by user interactions.
Code Splitting: Utilize Next.js’s automatic code splitting features and add custom split points where necessary.
Tree Shaking: Ensure your build process effectively eliminates dead code.
Real-world Example
We once worked on a project where a large data processing library was accidentally imported on the client-side, significantly increasing the bundle size. By moving this processing to an API route on the server, we reduced the client-side bundle by 30% and improved load times across the site.
Actionable Advice:
Audit your imports regularly, especially in shared components that might be used in both server and client contexts.
Set up Bundle Analyzer as part of your build process and review it before major releases.
Create a checklist for code reviews that includes checking for appropriate code splitting and lazy loading implementation.
EXPERT INSIGHTS, FRICTIONLESSLY DELIVERED!
Curated tech news delivered straight to your inbox every month.
Lesson 4: Build a Performance-First Team Mindset
Delivering consistently high-performance applications requires everyone, from developers to project managers, to focus on performance at every stage. At Pagepro, we’ve made performance optimization a shared responsibility, where continuous learning and improvement are at the core. Each team member plays a crucial role in embedding performance considerations throughout the development process, ensuring that our applications are fast, efficient, and scalable from the ground up.
Key Aspects of a Performance-First Culture:
Shared Responsibility: Everyone, from designers to developers to project managers, plays a role in performance optimization.
Continuous Learning: Regular knowledge sharing and staying updated on the latest performance best practices.
Performance-Centric Processes: Integrating performance considerations into every stage of the development lifecycle.
How We Build a Performance-First Culture at Pagepro:
1. Project Kickoff:
Set specific, measurable performance goals for each project.
Discuss potential performance challenges and strategies to address them.
Maintain a knowledge base of performance-friendly libraries and practices.
Implement pair programming sessions focused on performance optimization.
4. Code Reviews:
Include performance-specific checklist items in our code review process.
Use automated tools to flag potential performance issues before human review.
5. Regular Performance Workshops:
Conduct monthly “Performance Deep Dives” where we analyze a specific project or technology.
Encourage team members to share their performance wins and lessons learned.
6. Performance Recognition Program:
Implement a point system for performance improvements.
Celebrate team members who significantly enhance project performance.
7. Client Education:
Educate clients about the importance of performance and its impact on their business goals.
Provide regular performance reports and recommendations for ongoing improvements.
Actionable Advice:
Start with education: Conduct workshops to ensure all team members understand the basics of web performance and its importance.
Lead by example: Have senior team members champion performance best practices.
Make it measurable: Set team and individual OKRs (Objectives and Key Results) related to performance improvements.
Create feedback loops: Regularly gather insights from team members on performance challenges and successes.
Lesson 5: Limit data transfer to the minimum
For high-performance applications, reducing unnecessary data transfer is key to improving speed and efficiency. Optimizing data transfer improves load times, reducing server costs, and ensuring a smooth user experience. At Pagepro, we’ve developed several strategies to minimize data transfer and improve application performance.
Key Strategies for Data Transfer Optimization:
Minimize Over-fetching:
Implement GraphQL for more granular control over data fetching.
Use REST API effectively by onlyrequesting necessary fields.
Efficient Pagination:
Implement server-side pagination instead of loading all data upfront.
Use cursor-based pagination for large datasets to improve efficiency.
Caching Strategies:
Implement intelligent caching for data that doesn’t change frequently.
Use service workers for offline caching and faster subsequent loads.
Optimized State Management:
Use efficient state management solutions like React Query or SWR.
Implement optimistic UI updates to improve perceived performance.
Compression and Data Formats:
Use Brotli or Gzip compression for API responses.
Consider binary data formats like Protocol Buffers for very large datasets.
Lazy Data Loading:
Implement lazy loading for data associated with off-screen components.
Use intersection observers to trigger data loading as elements come into view.
Leveraging Next.js Features
While focusing on these advanced strategies, don’t forget to leverage Next.js’s built-in optimization features:
Use the Image component for automatic image optimization.
Implement Incremental Static Regeneration (ISR) for dynamic content that doesn’t need real-time updates.
Utilize API Routes for moving data fetching to the server-side where appropriate.
Real-world Impact
On a recent e-commerce project, we implemented a combination of the above strategies. By moving to server-side pagination, implementing efficient caching, and optimizing our GraphQL queries, we reduced initial page load data transfer by 60% and improved Time to Interactive by 45%.
Actionable Advice:
Conduct a data audit: Analyze your application’s data needs and identify opportunities for optimization.
Implement monitoring: Use tools like Datadog or New Relic to track API performance and data transfer metrics.
A/B test optimizations: Gradually roll out data transfer optimizations and measure their impact on real-world performance.
Stay updated: Keep an eye on new Next.js features and updates that can help with data optimization.
Fix Core Web Vitals for Your Next.js Website
Download our free ‘Fix Core Web Vitals: Next.js Optimization Guide for High-Traffic Websites’ and discover actionable strategies to improve performance, boost SEO, and enhance user experience on your Next.js site.
PDF
Check your email for the comprehensive Next.js guide!
Improving Next js Performance – Conclusion
Optimizing large-scale Next.js websites is an ongoing process that involves many different strategies. Using the right browser tools, continuously monitoring performance, managing server and client-side code effectively, creating a performance-focused culture, and reducing data transfer are all key steps to making your web applications faster and more efficient.
At Pagepro, the above 5 lessonshave been transformative in our approach to building and maintaining high-performance Next.js applications. We’ve seen how these strategies lead to faster load times, better user experiences, and, most importantly, stronger business results for our clients.
Start implementing these lessons in your development cycle, and you’ll be well on your way to creating blazing-fast Next.js applications that delight your users and drive your business forward.
What performance optimization strategies have worked well for your team? Share your experiences in the comments below – let’s learn from each other and push the boundaries of what’s possible with Next.js!
Looking for Experts to Improve Next.js Performance?